
Introduction
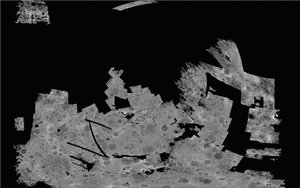
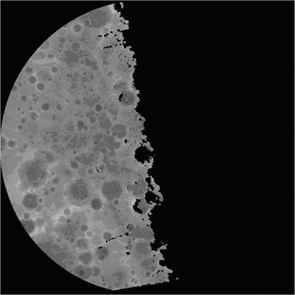
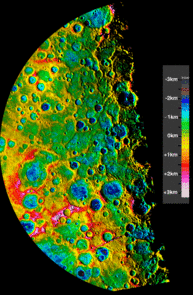
When NASA’s Mariner 10 probe visited the planet Mercury, between 1974 and 1975, some of the images captured, overlapped and formed stereo pairs. Unfortunately distortions present in the Mariner 10 vidicon camera images1 prevented reliable topographic maps from being constructed for over a quarter of a century. The vidicon images remained in this state until improved camera calibration software2, developed by Mark Robinson at North Western University (IL, USA), stereo image matching software3 supplied by University College London and Laser Scan (UK), and a cartographic mapping project4 at the Smithsonian’s National Air and Space Museum (Washington D.C., USA) allowed the first digital terrain model (DTM) of approximately a quarter of the surface of Mercury to be constructed. This is illustrated here in the form of two digital terrain models (DTMs), a simple cylindrical projection of the mid latitude zone of the planet (Fig. 1) and a polar stereographic projection of the south pole (Fig. 2).
Method
The refined camera positions and orientations of images from an improved image mosaic of Mercury2 were used to determine initially a revised list of stereo pairs according to a set of stereo criteria4. The stereo matching software, "Gotcha" used a patch-based correlation algorithm to find corresponding points between left and right images to sub pixel accuracy. Image pairs were matched 12 times using correlation patch radii of between 1 and 12 pixels. Small patch sizes yielded DTMs with high spatial resolution, but suffered increased topographic noise, especially in low textured areas (poor correlation). Large patch sizes suffered less from noise, but tended to blur spatial resolution. The DTMs from different patch sizes were combined together to achieve best spatial resolution, and least topographic noise5,6.
To convert stereo matcher pixel coordinates into longitude, latitude, and height, the coordinates are passed through a stereo intersection camera model using previously determined camera positions and orientations, based upon a photogrammetric adjustment2 of Mariner 10 images. The DTMs generated for each stereo pair were then combined together to generate a weighted map projected DTM mosaic. The DTMs had different height accuracies, and could also contain localized topographic errors resulting from badly detected image reseaux or stereo matcher errors due to image noise. Furthermore, errors in camera positions and orientations may have introduced slight vertical offsets and horizontal first order tilts. An iterative process was used whereby a weighted average DTM was generated from all DTM stereo pair tiles; each tile was fitted to this average DTM mosaic to compensate for offset and first order tilt. The process was repeated a specified number of times to produce an optimal fit. The weighting scheme used depended upon the average topographic noise present in each DTM tile, and the photogrammetric error (skew) for each matched point.
Results
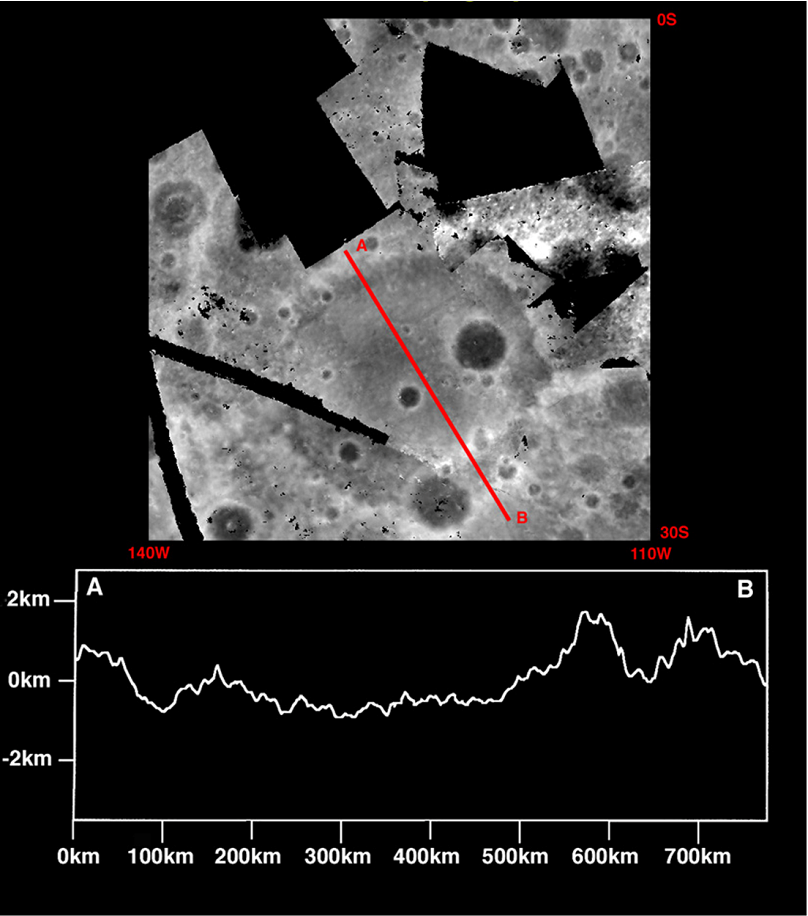
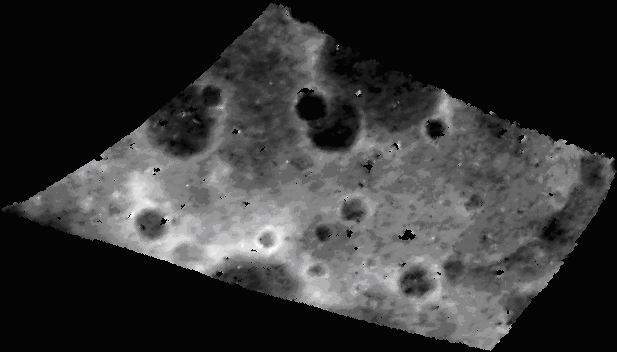
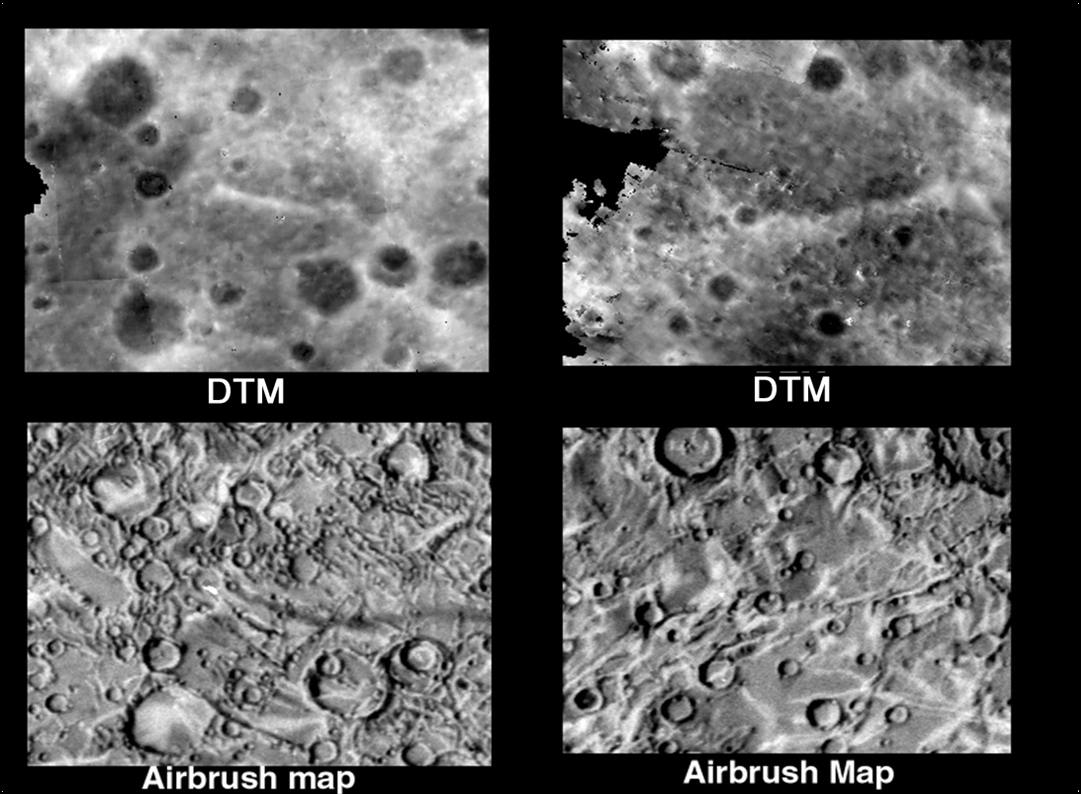
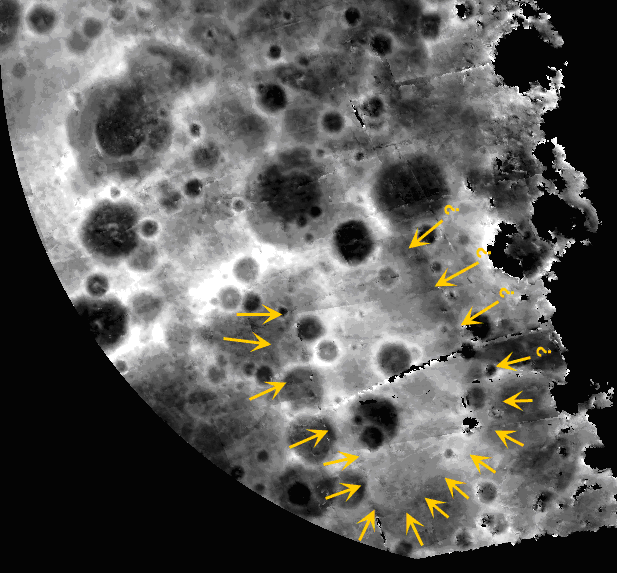
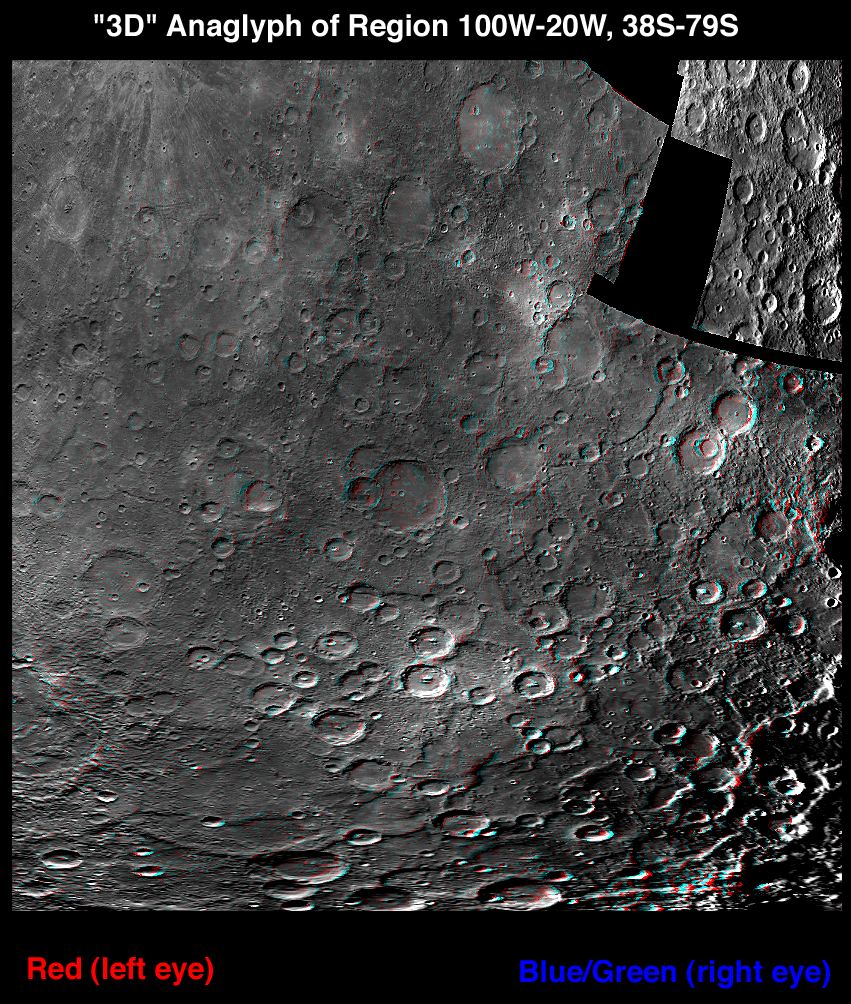
Out of 2326 predicted stereo pairs4, ~1700 proved suitable for stereo matching. Unsuitable stereo pairs included those with image data gaps and where the overlap was too small. The two DTM mosaics have image scales of 2 km/pixel. In both DTMs the black areas were where no stereo imagery was available. The DTMs in Figures 1 and 2 have been scaled in terms of grey shade from black=-6.4 km to white =+6.4 km. Height accuracy varies across the DTM – this is discussed in a paper by Cook and Robinson4. All heights are relative to a 2439 km radius assumed surface of Mercury. The DTMs mosaics show that the planet has a relatively small topographic range7, has shallower impact basins8,9 (Fig. 3) compared to the Moon, and many examples of 1-2 km high lobate scarps10 (Fig. 4) which formed due to the planet’s crust contracting from long term cooling of the interior. Other interesting topographic features were linear ridges (Fig. 5), and a large lobate structure (Fig. 6). Finally, Fig. 7 shows a stereo anaglyph view of part of the DEM mosaic.
Disclaimer
As with all DTMs, artefacts are present to some degree, but the non-linear geometry of vidicon cameras makes this more acute than with modern CCD cameras. In the DTM mosaics, height accuracy4 worsens where the DTM becomes obviously noisy and fretted in appearance. Other DTM artefacts to be aware of are occasionally the camera orientation of an image maybe incorrectly determined/compensated for, and this results in image edges sometimes showing up in the DTM mosaic. Badly identified vidicon image reseaux calibration marks within noisy images could cause image distortions too. Although the majority of these were caught in the processing software and sections of the images removed from contributing to the DTM mosaic, it is possible that a few may have remained undetected – these could form spurious peaks or depressions in the combined DTM. Lastly, because the DTM mosaic was composed from DTMs from different stereo image pairs, of different resolutions and viewing directions, when studying specific geomorphological features, it may often be an advantage to investigate individual DTM stereo pair tiles in case these have higher height accuracy than the combined DTM mosaic. Raw DTM tiles that went into these mosaics are available in archives held at the Center for Earth and Planetary Studies, National Air and Space Museum, Washington D.C. (Email: watterst@si.edu), and at the Institute of Mathematics and Physics, Aberystwyth University, UK (Email: atc@aber.ac.uk), upon request.
Acknowledgment
This work was accomplished under NASA PG&G grants NAG5-9076 and NAG5-10291 and on-line publication made available through Europlanet.
Relevant Publications
Last update: 05/10/2011 13:24